

Published Jul 01, 2024 • 4 min read

Shiny, developed by RStudio, is an open-source R package that allows users to build interactive web applications directly from R. By using Shiny, businesses can turn complex data analyses into intuitive, interactive web dashboards without needing extensive web development skills. This makes it an invaluable tool for IT solution services, data scientists, analysts, and business intelligence professionals. Combining Shiny with AWS cloud services adds unparalleled scalability and performance, making it an ideal choice for businesses seeking robust IT software solutions.
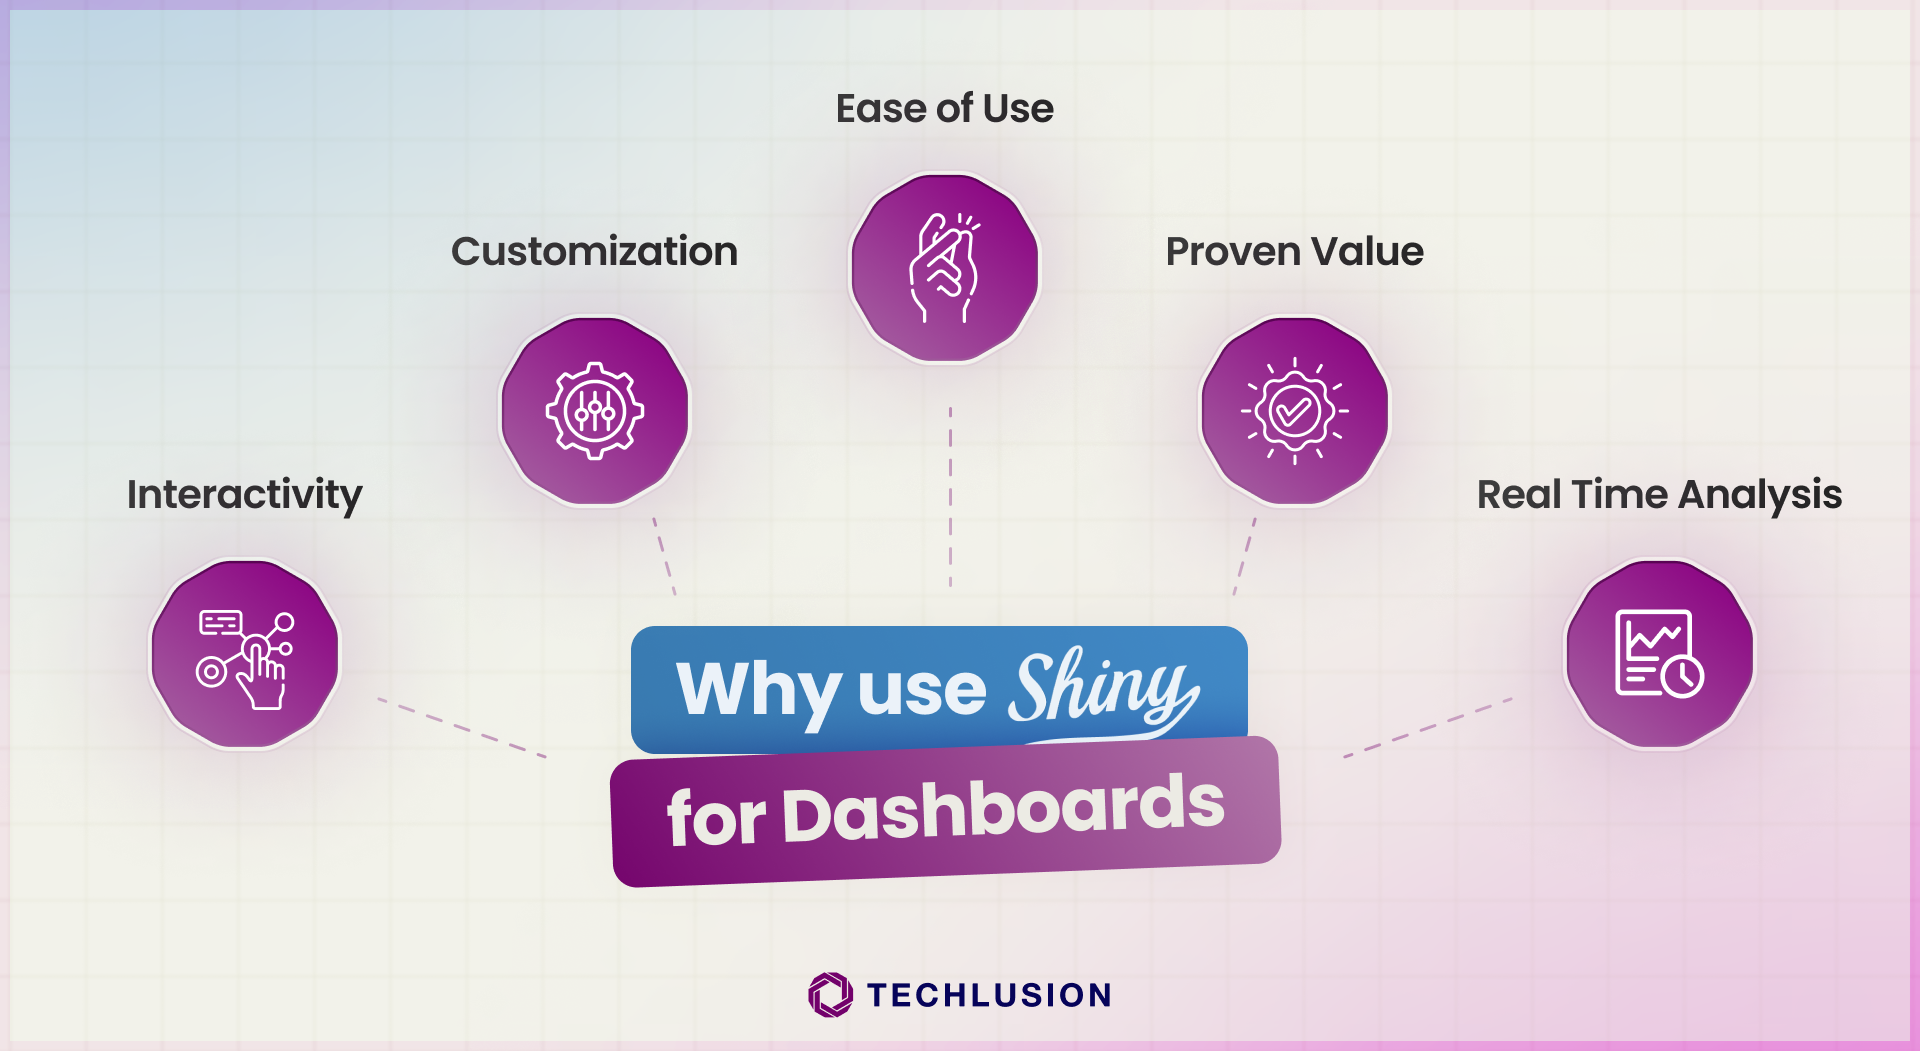
Here’s why Shiny on AWS is the go-to solution for creating interactive dashboards that drive business growth:
Shiny applications empower users to manipulate data visualizations in real time. With Shiny on AWS, businesses can unlock deeper insights and support better decision-making. For example, industries like healthcare and finance benefit greatly from these real-time capabilities.
Shiny offers extensive customization features, allowing businesses to design dashboards that align perfectly with their branding and goals. Paired with AWS’s flexibility, you can scale your IT solutions & services to meet your exact requirements.
Shiny’s intuitive interface makes it accessible to users with varying technical expertise. When deployed on AWS, the process becomes even more streamlined, offering a seamless experience for small companies looking to leverage IT solutions support.
Shiny on AWS is trusted across various industries to derive actionable insights:
Creating a Shiny dashboard involves three main steps:
First, install the Shiny package in R:
install.packages("shiny")
A Shiny application consists of a user interface (UI) and a server function. The UI defines the layout, while the server function handles the application’s logic.
Here’s a simple example:
library(shiny)

ui <- fluidPage(
  titlePanel("Simple Shiny Dashboard"),
  sidebarLayout(
    sidebarPanel(
      sliderInput("obs", "Number of observations:", min = 1, max = 100, value = 50)
    ),
    mainPanel(
      plotOutput("distPlot")
    )
  )
)

server <- function(input, output) {
  output$distPlot <- renderPlot({
    hist(rnorm(input$obs))
  })
}

shinyApp(ui = ui, server = server)
Run your Shiny app locally using the shinyApp function, which opens a web browser to display your interactive dashboard.
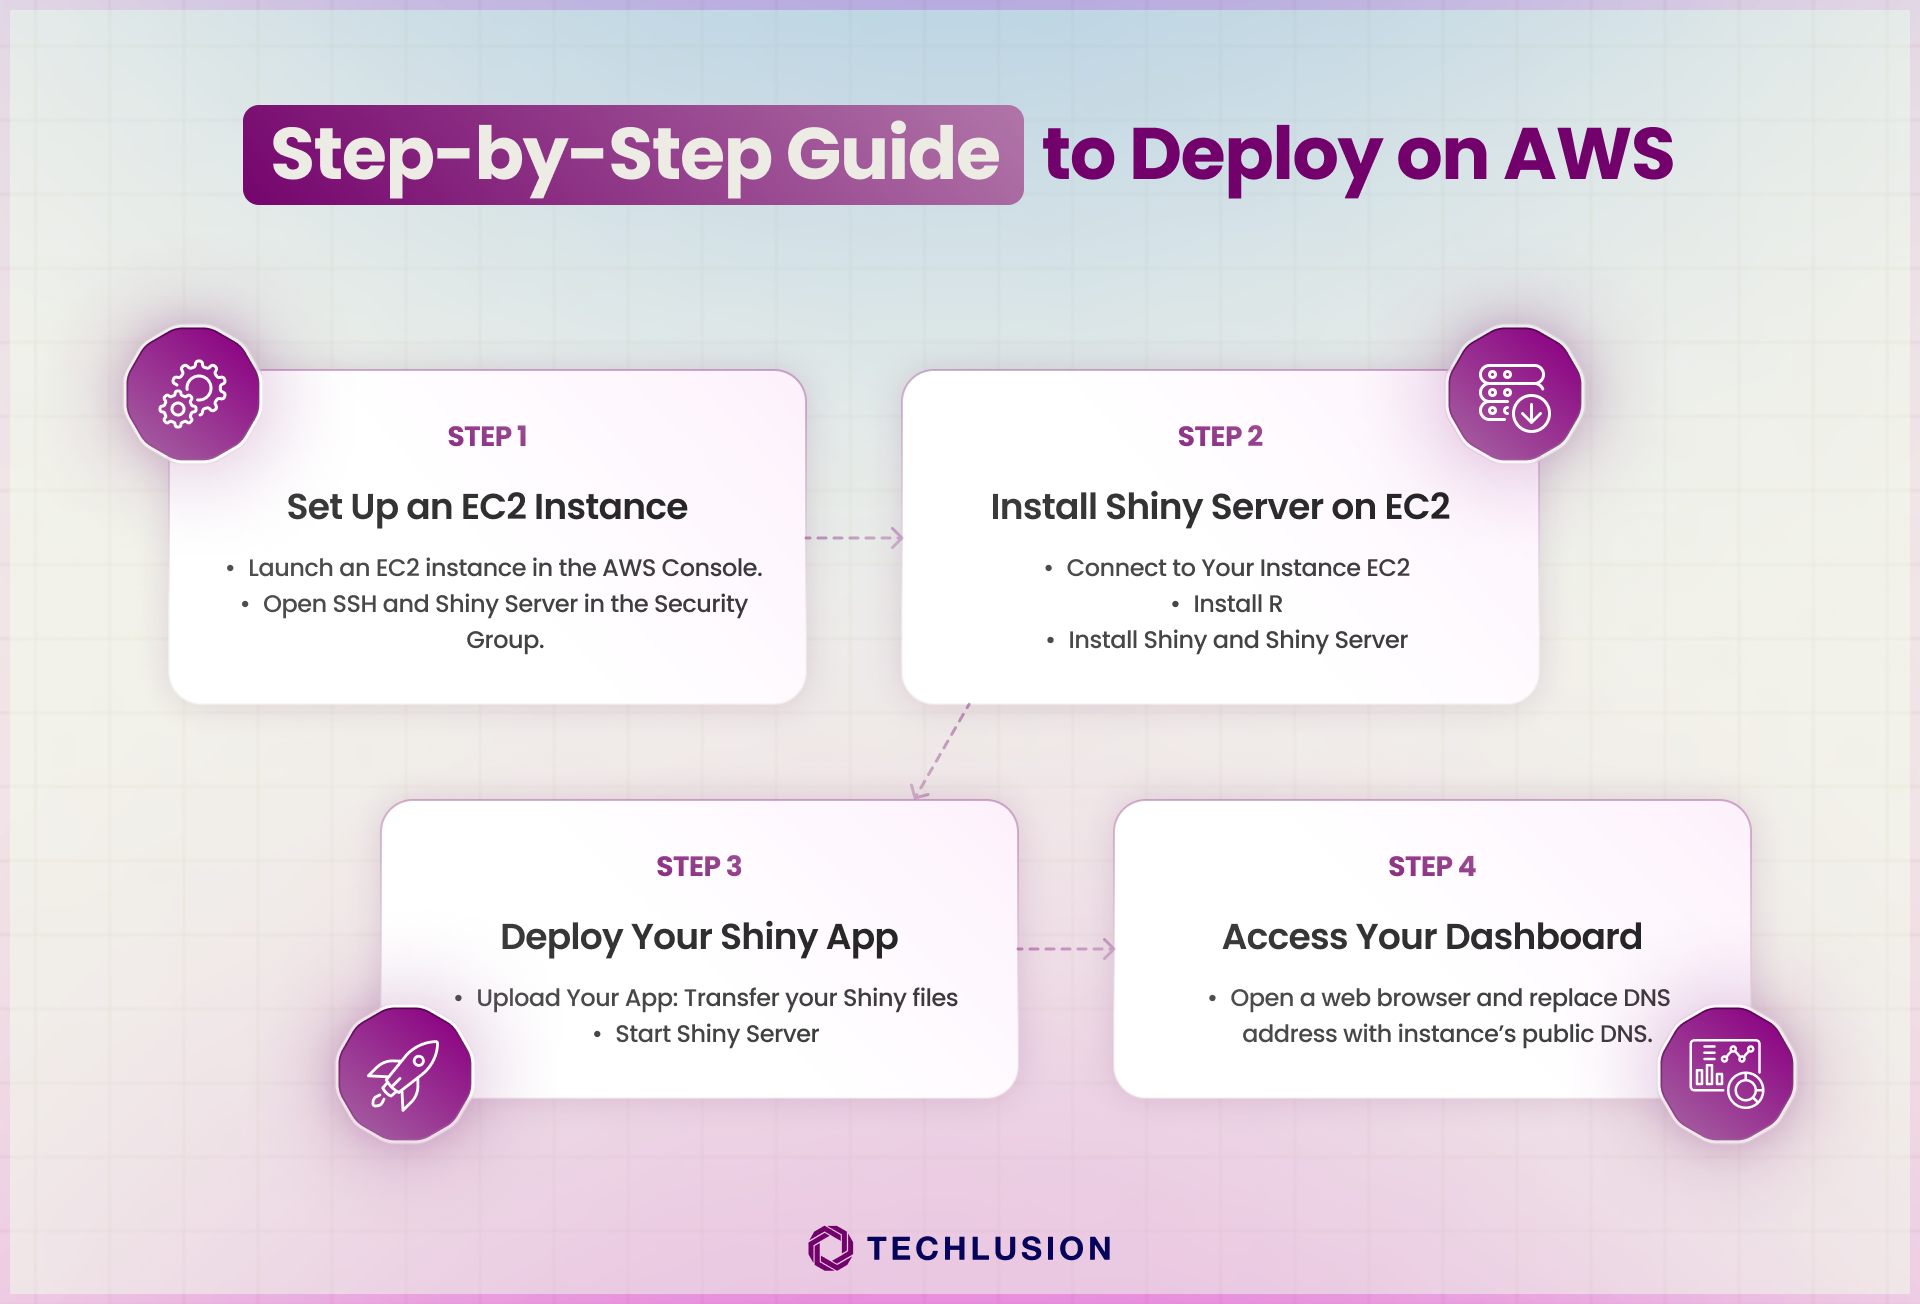
To make your Shiny dashboard accessible across your organization, deploying it on AWS is a smart choice. AWS offers scalability, reliability, and security, ensuring your dashboards perform optimally.
sudo amazon-linux-extras install R3.4
sudo su - -c "R -e \"install.packages('shiny', repos='https://cran.rstudio.com/')\""
sudo yum install -y gdebi-core
wget https://download3.rstudio.org/ubuntu-14.04/x86_64/shiny-server-1.5.16.958-amd64.deb
sudo gdebi shiny-server-1.5.16.958-amd64.deb
sudo systemctl start shiny-server
Open a web browser and navigate to http://<your-ec2-public-dns>:3838/your-app, replacing <your-ec2-public-dns> with your instance’s public DNS.
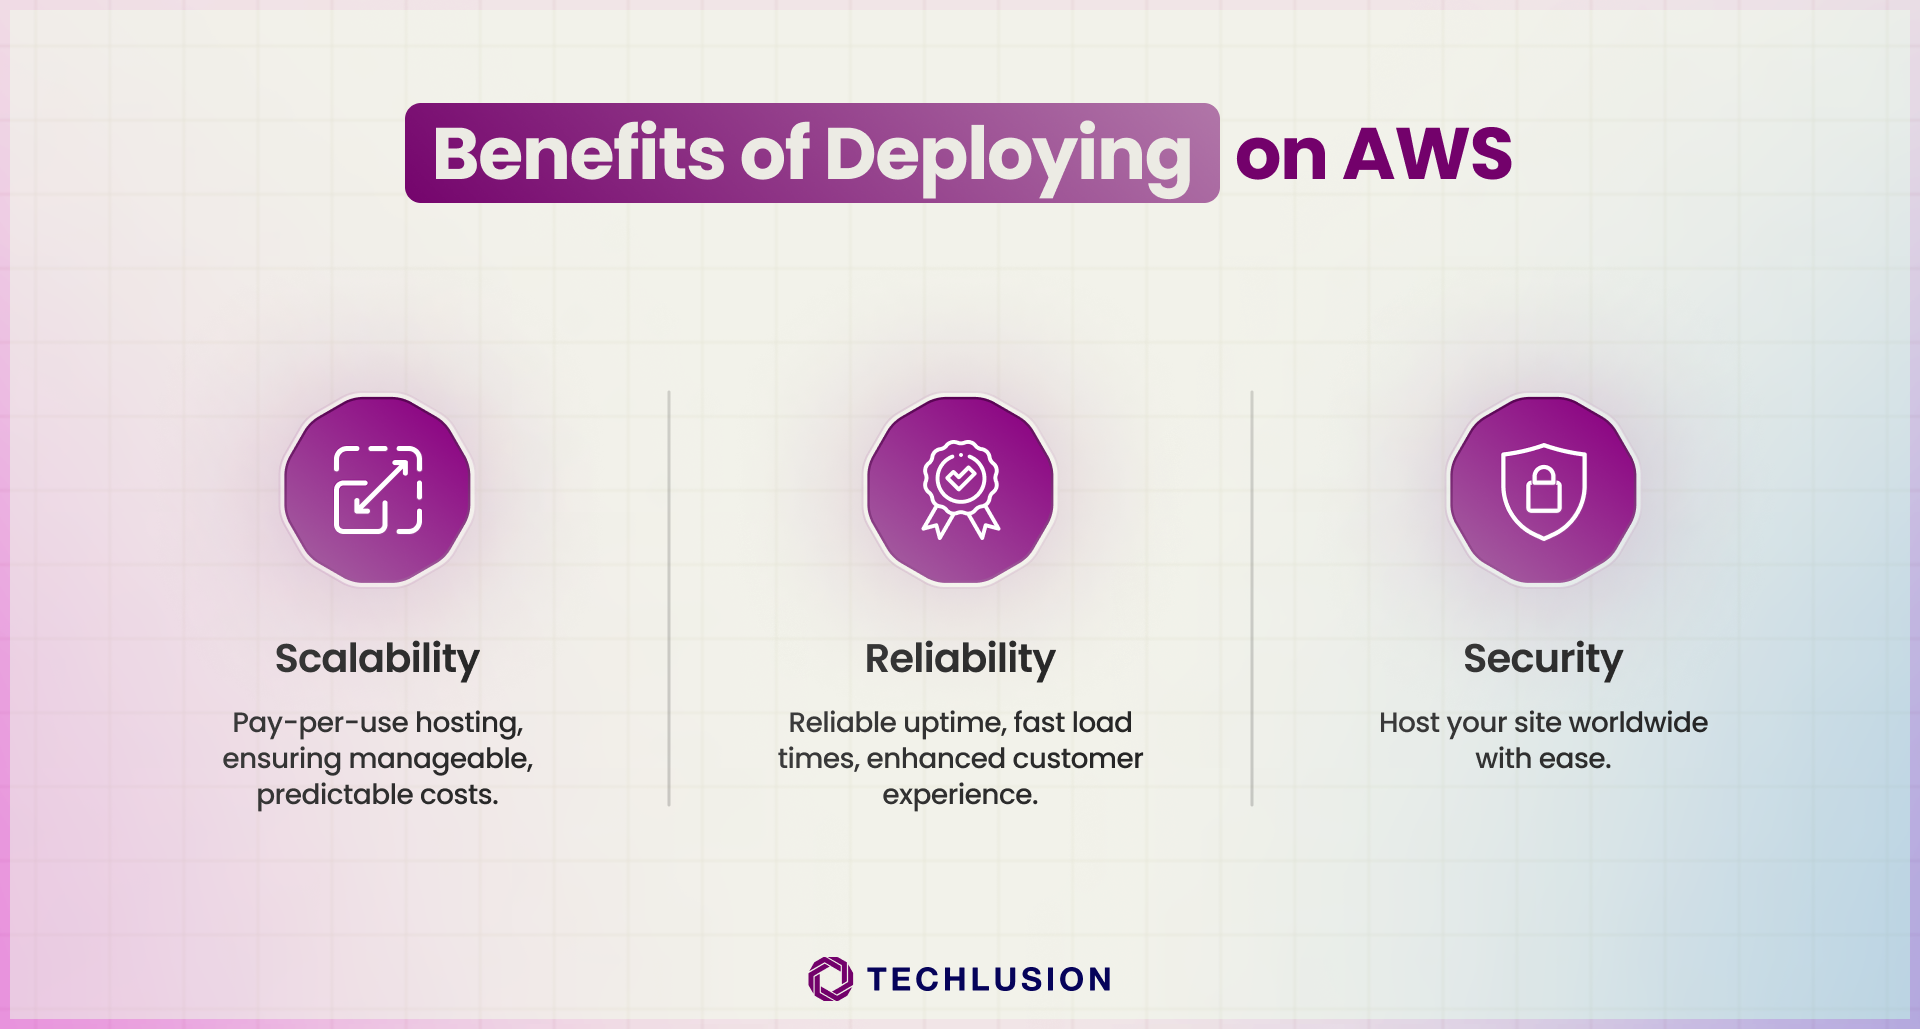
AWS allows you to scale your infrastructure as your business grows. Easily add more instances or increase resources based on demand.
AWS’s robust infrastructure ensures high availability and uptime, so your dashboards are always accessible.
AWS provides advanced security features, including network firewalls, encryption, and compliance certifications, ensuring your data is secure.
Shiny offers a powerful and flexible framework for creating interactive web dashboards, while AWS provides the scalability and reliability needed to deploy these dashboards effectively. By combining Shiny and AWS, you can create customized, interactive dashboards that provide real-time insights and support better decision-making across your organization.
At Techlusion, we are committed to helping businesses unlock the full potential of their data. Start leveraging Shiny and AWS today to elevate your business insights!

Other interesting read : Strengthening Healthcare Security: Techlusion’s Guide to HIPAA Compliance and AWS Integration.