

Published Jun 19, 2025 • 3 min
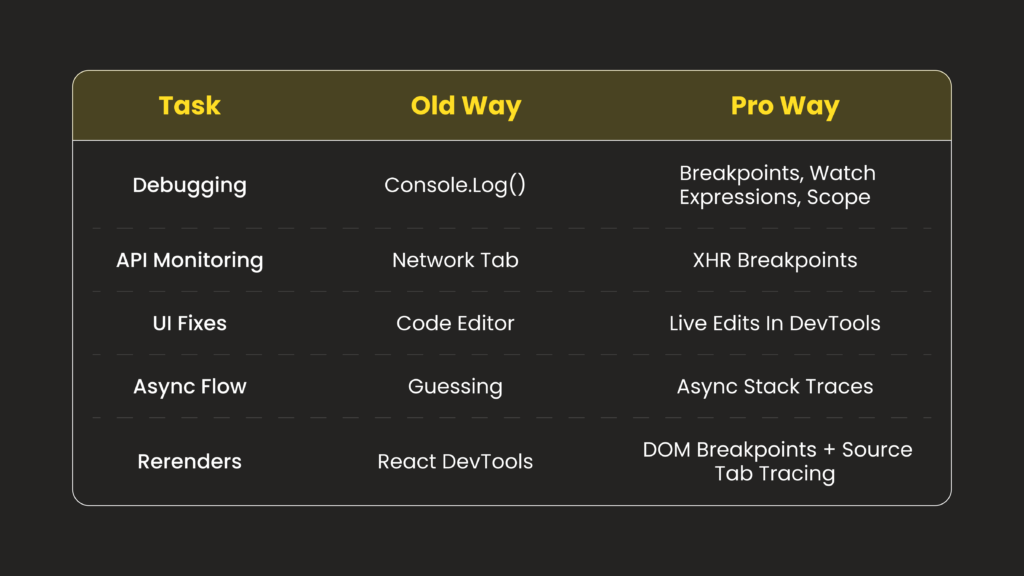
Let’s be honest: console.log() is easy, but also limiting—especially in complex front-end frameworks like React, Angular, or Vue.
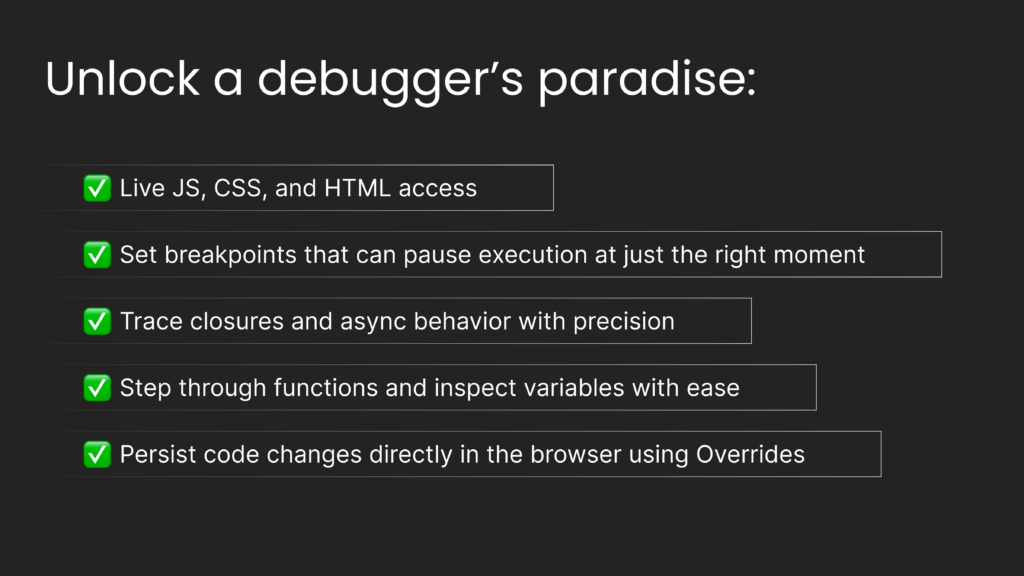 If you’re looking to level up your debugging stack and go beyond log-spam, mastering the chrome developer tools debugging capabilities is essential.
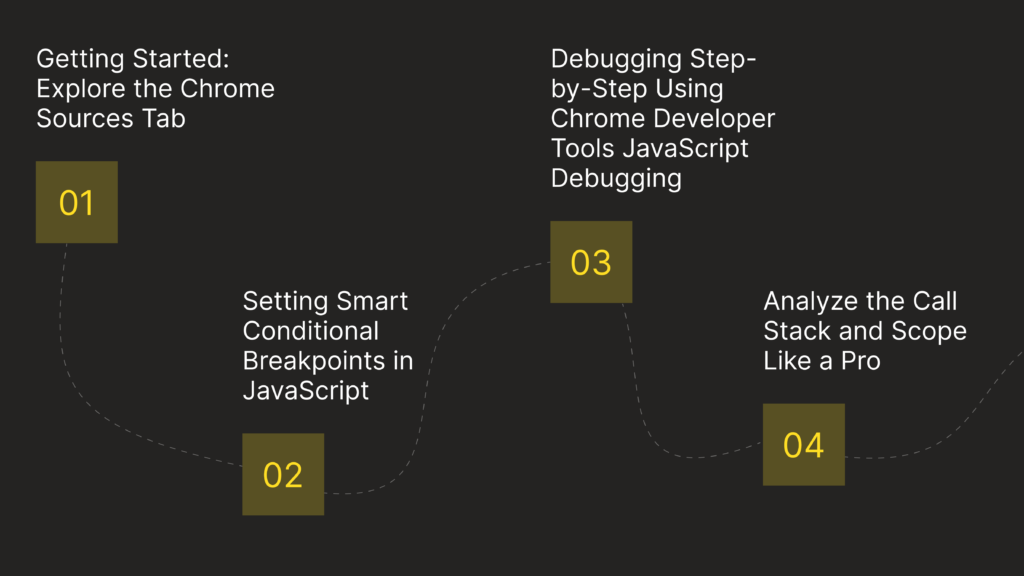
To open the chrome sources tab, right-click on any page and select Inspect, or press Ctrl+Shift+I / Cmd+Opt+I. Then click on the “Sources” tab.
You’ll find three key panels:
🔹 Pro Tip: Use Cmd+P / Ctrl+P to quickly jump to any file by name—this dramatically speeds up your workflow.
When it comes to debugging, breakpoints are your best friend.
Here’s how to add different types of breakpoints:
By learning how to add conditional breakpoints and chrome dom breakpoints, you replace guesswork with precision. This is a core method of debug javascript in chrome and avoids code bloat from excessive logs.
Once paused on a breakpoint, use the following step controls to understand how your code executes:
▶️ Resume (F8)
⏭ Step Over (F10)
⏬ Step Into (F11)
⏫ Step Out (Shift+F11)
With these tools, you gain fine control over execution context. Whether you’re deep in a React component lifecycle or tracking a recursive function, this is where the real debugging magic happens.
Once you’ve paused the code:
These features enable debugging javascript in chrome devtools with clarity, especially for state-heavy SPAs built on popular JS frameworks.
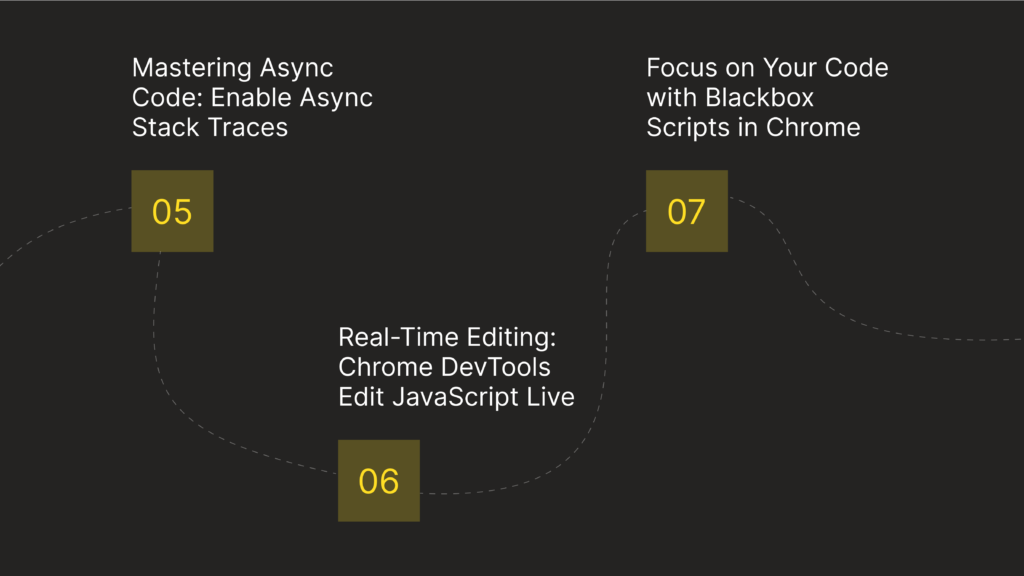
Asynchronous functions—whether fetch(), setTimeout(), or async/await—often obfuscate the origin of bugs.
To trace them:
👉 Go to DevTools Settings → Preferences
✅ Enable “async stack traces”
Now you’ll be able to inspect code across asynchronous boundaries, a feature critical for debugging with chrome devtools in real-world apps.
Tired of the code-editor → build → refresh cycle?
The Sources tab enables chrome devtools edit JavaScript live via:
Use this for:
✔️ Layout fixes
✔️ Logic tests
✔️ Collaborating with designers in real time
This accelerates iteration cycles and works great in QA and staging environments.
Third-party libraries like React or Lodash can clutter your debugging process. Use chrome blackbox script to skip over these libraries during step-through:
Now you’ll step over vendor code and focus only on your app’s logic—a huge time-saver for both frontend debugging and performance profiling.
Here are some advanced use cases that truly benefit from the power of the Source tab:
Whether you’re a solo developer, startup engineer, or part of a large team, knowing how to debug javascript in chrome using DevTools is a massive unlock. It saves time, improves code quality, and boosts your problem-solving precision.
For Engineering Teams and Tech Leads:
Encourage your dev team to move beyond console.log() and invest in mastering DevTools. It’s not just a skill—it’s an upgrade in engineering maturity. Use internal demos to share best practices, such as how to pause javascript execution, explore async behavior, and blackbox libraries efficiently.