What actually matters to measure
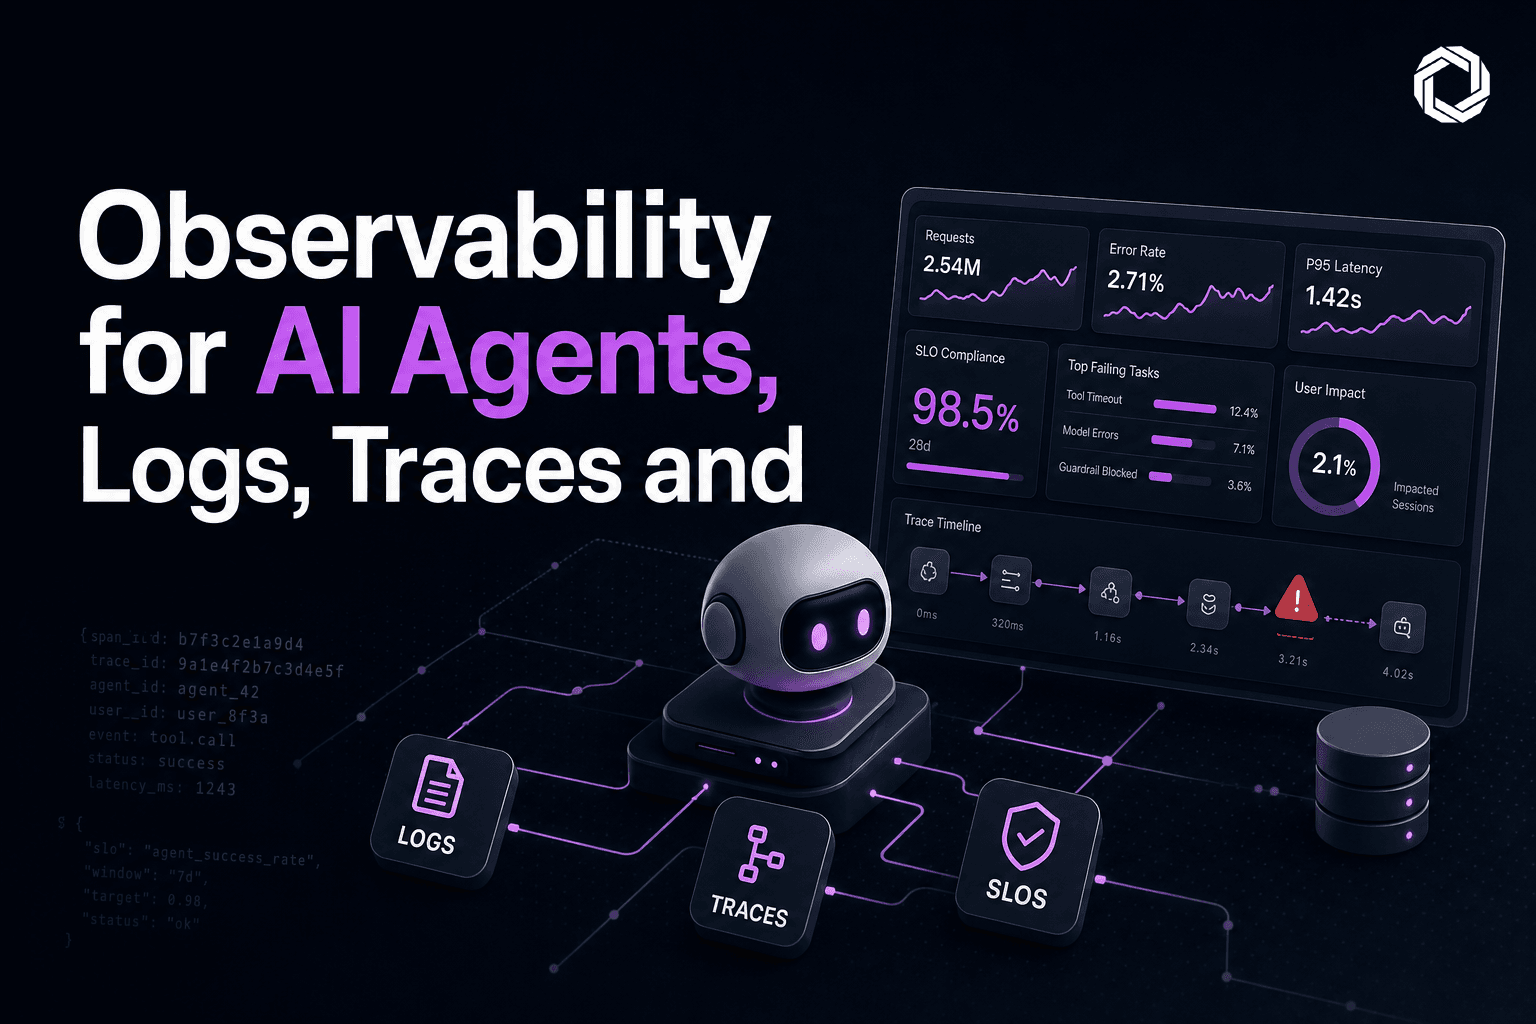
Run-time observability for AI agents is not about dumping every prompt and response into cold storage. It is about collecting signals that help you answer three operational questions within minutes. Is the agent available, is it accurate, and is it causing user harm or wasted cost. Focus on these signals first, then add extra context.
Signals to collect, in priority order.
- End to end task outcome, success or failure. Define success as a domain specific check, for example a booking created, a correct code patch applied, or a validated invoice parsed. This is the primary SLO target.
- Trace id and task id, propagated across every subsystem and tool call. You will use this to correlate logs, metrics and traces.
- LLM call metadata: model name, temperature, prompt token count, response token count, prompt hash or redacted text, request id from provider, latency, and cost. Don’t store raw PII in prompts, instead store a hashed or redacted copy and the token counts.
- Tool call metadata: tool name, tool success/failure, tool latency, tool error class. For external APIs include upstream request id and status code.
- Hallucination indicators: structured fact-check events, assertion failures, embed-similarity scores against trusted sources, or simple heuristics like unexpected entity types or hallucination model score.
- Retry and fallback events, and why the agent retried, including which policy triggered.
- System signals: CPU, memory, queue length, concurrency, and queue wait times for any agent runtime you control.
- Cost metrics: token cost per request, tool cost per request, and cumulative cost per task.
Collecting all of this at the right cardinality matters. Collect full metadata for every LLM and tool call. Sample full prompts at 1 to 5 percent, but always store prompt hashes and token counts.
How we instrumented agents, with a code sample
We used OpenTelemetry spans for distributed traces and structured JSON logs for events. A single trace id is passed through the agent controller, the model client and each tool connector. Here is a minimal Python example showing how we attach metadata and emit a structured log event. You can adapt this to any language that supports OpenTelemetry and structured logging.
from opentelemetry import trace
import hashlib, json, time

tracer = trace.get_tracer(__name__)

def redact_prompt(prompt):
    # keep a short preview, and a hash for lookup without saving PII
    preview = prompt[:200]
    h = hashlib.sha256(prompt.encode()).hexdigest()
    return {"preview": preview, "prompt_hash": h}

def call_model(task_id, prompt, model_name, model_client):
    start = time.time()
    meta = redact_prompt(prompt)
    with tracer.start_as_current_span("llm_call", attributes={
        "task.id": task_id,
        "model.name": model_name,
        "prompt.hash": meta["prompt_hash"],
        "prompt.preview": meta["preview"]
    }) as span:
        resp = model_client.send(prompt)
        latency = time.time() - start
        span.set_attribute("llm.latency_ms", int(latency*1000))

        # structured log event
        event = {
            "ts": int(start*1000),
            "task_id": task_id,
            "event": "llm_response",
            "model": model_name,
            "latency_ms": int(latency*1000),
            "tokens_in": resp.tokens_in,
            "tokens_out": resp.tokens_out,
            "provider_id": resp.provider_id
        }
        print(json.dumps(event))
        return resp
That print can be replaced with your structured log emitter. The important parts are the task id and the prompt hash, which let you join traces to sampled prompt text without leaking sensitive data.
How to define SLOs and map signals to user impact
SLOs for agents should be user centered, not model centered. The model call is an implementation detail. Start with one or two user facing SLOs and a few system SLOs.
Example primary SLOs to try.
- Task Success Rate, 30 day rolling, target 99 percent. A task is a user initiated intent that completes with a verified success predicate.
- End to End Latency p95, 7 day window, target 5 seconds for interactive agents and 30 seconds for long-running workflows.
- Hallucination Rate, measured on a sample of verified responses or via automated checks, target less than 1 percent of user-visible assertions.
Secondary SLOs.
- LLM provider p95 latency per call, target 2 seconds. This helps you notice upstream provider regressions.
- Tool failure rate by tool, target less than 0.5 percent.
- Token cost per successful task, target depends on product economics.
Mapping signals.
- If Task Success Rate drops, correlate to the trace ids for failed tasks and inspect tool failure rates, model latency spikes, increased hallucination indicators, or changes in prompt token counts.
- If LLM p95 latency climbs, you will see queue length increase and end to end latency climb. Alert on provider latency first, then on user impact.
- If hallucinations rise, look at prompt token counts, temperature changes, or recently deployed prompt policy changes. Also compare embedding similarity scores against trusted sources.
Dashboards and alerts we used in production
We built three dashboards and a short alert list. Keep them small and actionable.
Dashboard 1, Overview for product ops
- Task Success Rate over time, rolling 7 day and 30 day
- End to end latency percentiles, p50 p95 p99
- Hallucination rate trend
- Cost per successful task
Dashboard 2, LLM provider health
- LLM call rate, p95 latency, error rate, and provider request ids
- Token consumption rate and cost
- Alert timeline for provider outages or throttling
Dashboard 3, Tool health and dependency map
- Per-tool failure rate and latency by region
- Retries and circuit-breaker events
- Correlation scatter of tool latency vs task success
Minimum alert set, actionable and limited in number
- High SLO burn, Task Success Rate SLO at 50 percent of budget burned in 24 hours, page the oncall. Use a burn rate policy to avoid alert storms.
Prometheus style alert example.
groups:
- name: agent-slos
  rules:
  - alert: TaskSuccessSLOBurn
    expr: (1 - sum(rate(task_success_total[24h])) / sum(rate(task_total[24h]))) > 0.5
    for: 1m
    labels:
      severity: page
    annotations:
      summary: "Task Success SLO burning too fast"
      description: "More than 50 percent of the error budget consumed in 24h."
-
Hallucination rate increase, warn at 0.5 percent, page at 1 percent if sustained for 30 minutes.
-
Upstream provider p95 latency spike, alert when p95 > 4s for 10 minutes, escalate to ops.
-
Tool failure cascade, alert if more than two critical tools exceed 5 percent failure together.
Keep alert thresholds conservative. We had false positives by alerting on single-tool blips. Grouping related alerts and using a burn rate prevents chasing noise.
Trade offs, failure modes, and what I would change next time
Trade offs we made.
- We sampled full prompts to limit storage costs. That means rare failures sometimes lacked a full prompt for root cause. If root cause is critical, raise sample rate for failing cohorts or implement on-demand pull from a short term buffer.
- We hashed prompts to protect PII. This prevents reading the full prompt in the UI, which slowed debugging. For higher-trust teams, implement automatic redaction plus secure access logging, rather than hashing, to allow debug access under audit.
- We used local embedding-based hallucination checks, which catch many issues but add latency. We made them asynchronous for interactive flows, and synchronous for critical workflows only.
Failure modes we encountered.
- Missing trace propagation. If one connector forgot to forward trace ids, you lose correlation and the task looks like an anonymous failure. Enforce middleware that injects and validates trace headers at every boundary.
- Cost spikes from verbose logs during a provider outage. When providers slow, agents often retry and logs explode. Rate limit logs and aggregate repeated error messages.
- Blind alerts from model changes. When we switched model families, hallucination rates and token counts changed. Deploy model changes with feature flags, and run a staged rollout with observability gates.
What I would do differently now.
- Build a lightweight request buffer that stores raw prompts for 24 hours. Only create long term storage after approval. That gives fast debug access without long retention costs.
- Add automatic experiment tags to traces so A B test results are visible in the dashboards by default. We missed causality because rollout tags were sparse.
- Convert the most useful sampled prompt captures into synthetic test cases for CI, so regressions trigger before production rollout.
Where to get help
If you want a practical design for the tracing, logging and SLOs around your agent, our architecture review covers end to end design and tradeoffs. We also implement agent observability as part of our AI product engineering engagements, and we work with data pipelines for large scale signal collection. See our architecture review service at /services/architecture-review, our AI product engineering service at /services/ai-product-engineering, and our data engineering practice at /services/data-engineering for concrete implementations.
Observability for agents is discipline plus instrumentation. Start with task success, trace ids, LLM and tool metadata, and a small set of SLOs. Iterate on sampling, redaction, and automation so your ops and product teams can answer why users are failing, without sacrificing privacy or cost.